Cycle Duration
Understanding Cycle Duration in Market Analysis
In market analysis, understanding the duration and structure of cycles can provide deep insights into market movements and potential investment opportunities.
We categorize cycles into three main types: Daily, Intermediate, and Yearly Cycles. Each cycle type has distinct characteristics and durations, and they are interconnected, forming a hierarchy where smaller cycles build into larger ones.
Daily Cycle
The Daily Cycle is the smallest and most frequent cycle we monitor. This cycle typically spans about calendar 45-55 days for assets like the dollar, gold, miners, bonds, and commodities. However, the Daily Cycle tends to be slightly longer for equities, ranging from 55-70 calendar days. It's common for 3-5 Daily Cycles to comprise one Intermediate (Weekly) Cycle.
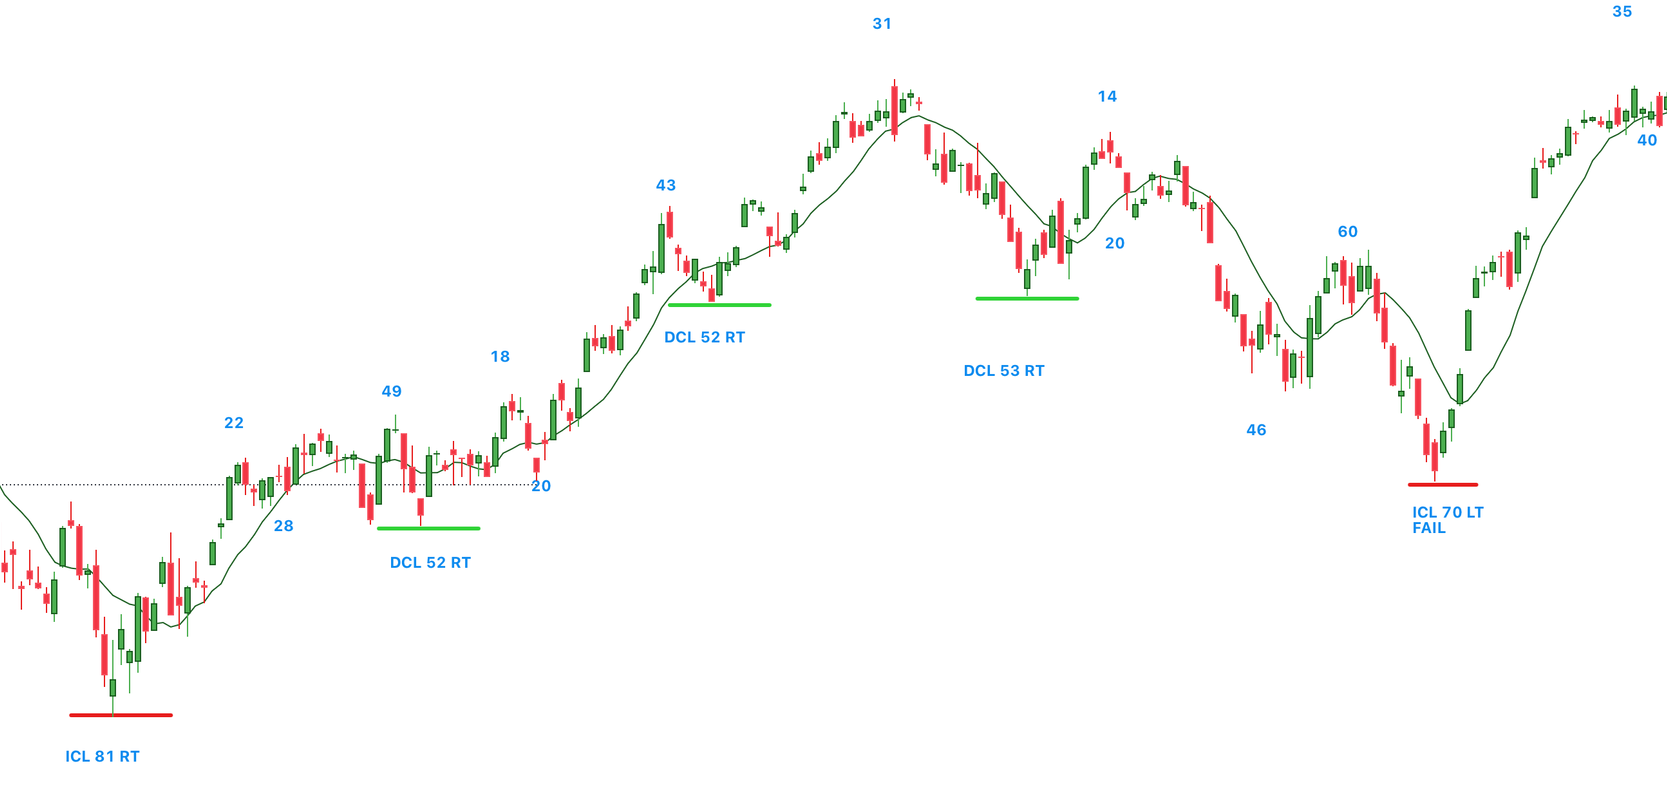
Let's analyze the below daily cycle to show how cycle moves

1st Daily Cycle
- HCH (Day 22): Typical behavior for the cycle.
- HCL (Day 28): Price remains above the 10 MA, indicating strength.
- DCH (Day 49): Cycle high occurs right of the midpoint, suggesting bullish momentum.
- DCL (Day 52): Marked as RT, indicating a right-translated daily cycle.
2nd Daily Cycle
- HCH (Day 18): Consistent with the previous cycle.
- HCL (Day 20): Briefly flat, yet price recovery was swift.
- DCH (Day 43): Strong recovery post-HCL, with the cycle high being RT.
- DCL (Day 52): RT and mirrors the previous cycle's behavior.
3rd Daily Cycle
- Significant Swing: Only notable event was the 10-day backtest; no clear HCH or HCL.
- DCH (Day 31): Relatively early in the cycle.
- DCL (Day 53): Despite being RT, the cycle neared failure, indicating potential weakness.
4th Daily Cycle
- HCH (Day 14): Early occurrence suggests the beginning of a decline towards an intermediate cycle low.
- HCL (Day 20): Flat performance and below the 10 MA, showing signs of weakness.
- Cycle Failure: Occurred on day 34, earlier than typical, indicating a failed cycle.
- DCL (Day 70): LT and failed daily cycle in time for an ICL.
Intermediate Cycle
Moving up in scale, the Intermediate Cycle comprises 2-5 Daily Cycles. Same as the Daily Cycles, Intermediate Cycles can also be right or left-translated, affecting the broader market trend. A typical Intermediate Cycle might show a pattern where Daily Cycles progressively print higher highs and lows until the peak of the Intermediate Cycle. A failed Daily Cycle, where the price breaks below the previous low, often signals the start of an Intermediate Cycle decline.

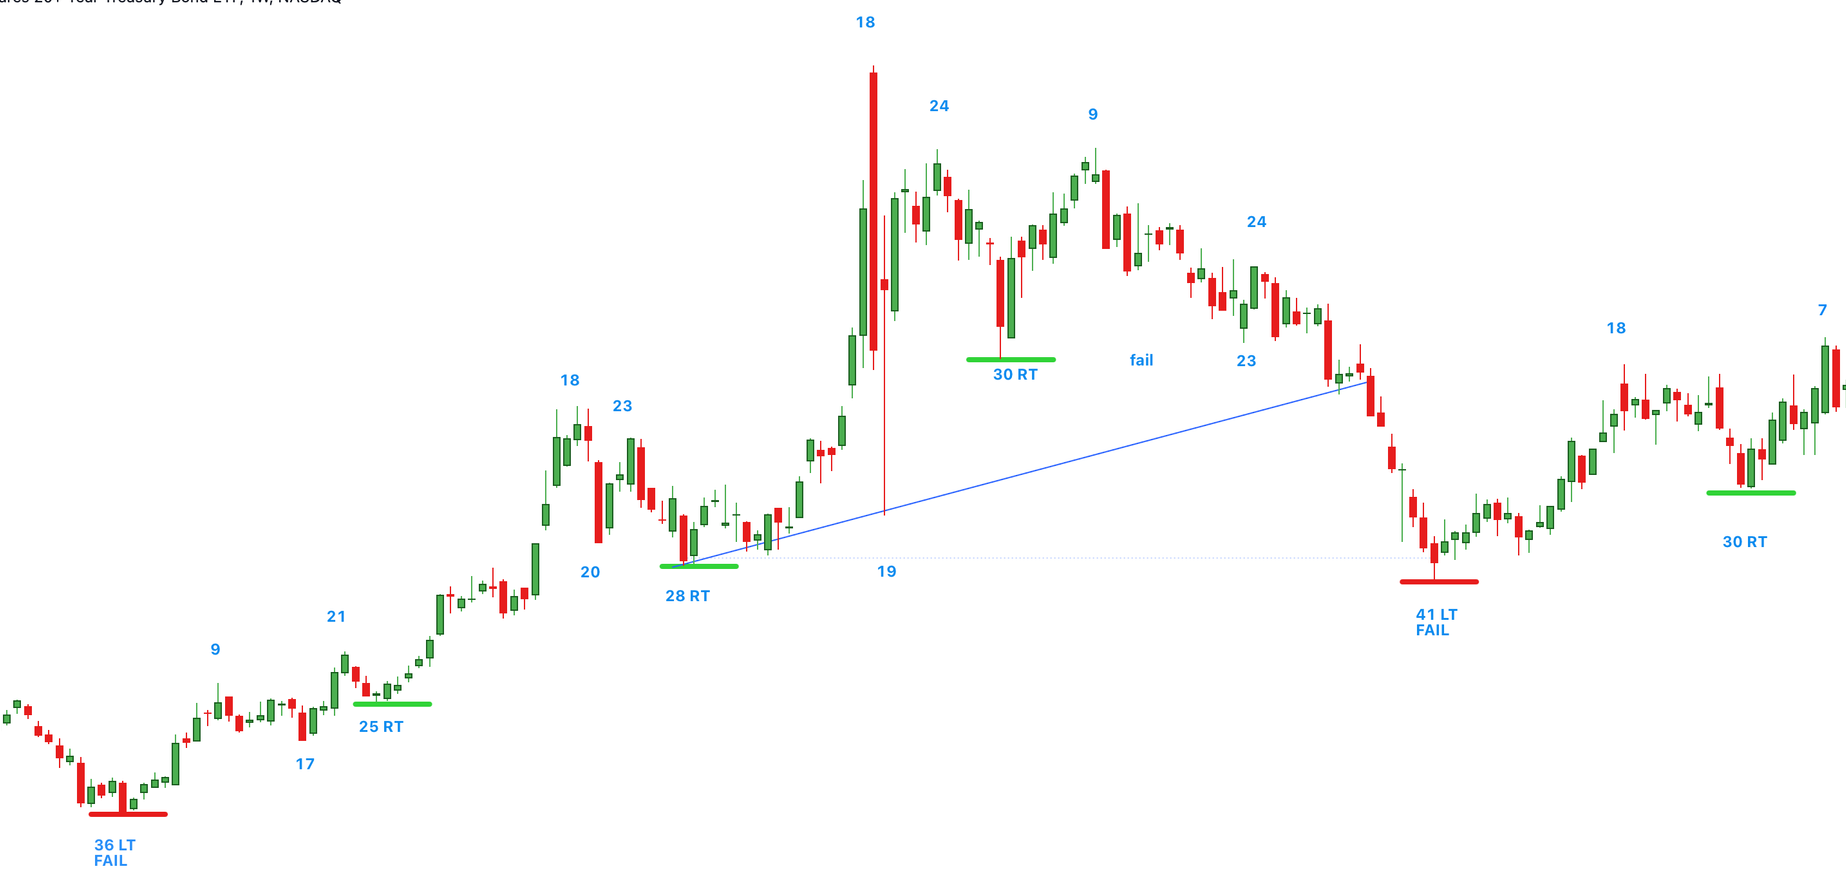
1st Weekly Cycle
- Starting Point: Yearly Cycle Low (YCL) marked by a 36 LT FAIL cycle.
- HCH: HCH achieved on week 9
- HCL: HCL reached by week 17, with a subsequent rise.
- ICH: Peaks at week 21 before a final decline.
- ICL: Concludes with cycle low on week 25 RT cycle
2nd Weekly Cycle
- HCH: Week 18 showing strength
- HCL: Week 20 staying above the weekly uptrend
- ICH: Week 23 and below week 18 cycle high
- ICL: Week 28 RT cycle
3rd Weekly Cycle
- HCH: Spike to HCH on week 18
- HCL: Dropped down to the cycle high trendline on week 19
- ICH: Lower high on week 24 indicating weakness
- ICL: Week 30 RT cycle, did not decline down to the cycle trendline
4th Weekly Cycle
- HCH: Early HCH on week 9 indicating start of the decline to YCL
- HCL: Failure into week 23
- ICH: Another lower high and early ICH on week 24
- ICL: Final decline in a failed and long weekly cycle ending on week 40 LT cycle
Yearly Cycle
The Yearly Cycle is the largest cycle we follow, typically comprising 2-4 intermediate cycles. It represents the best opportunity to add positions for cycle analysis. As the early cycle takes a long time to unfold, moves within the Yearly Cycle have significant implications on daily and weekly cycles.

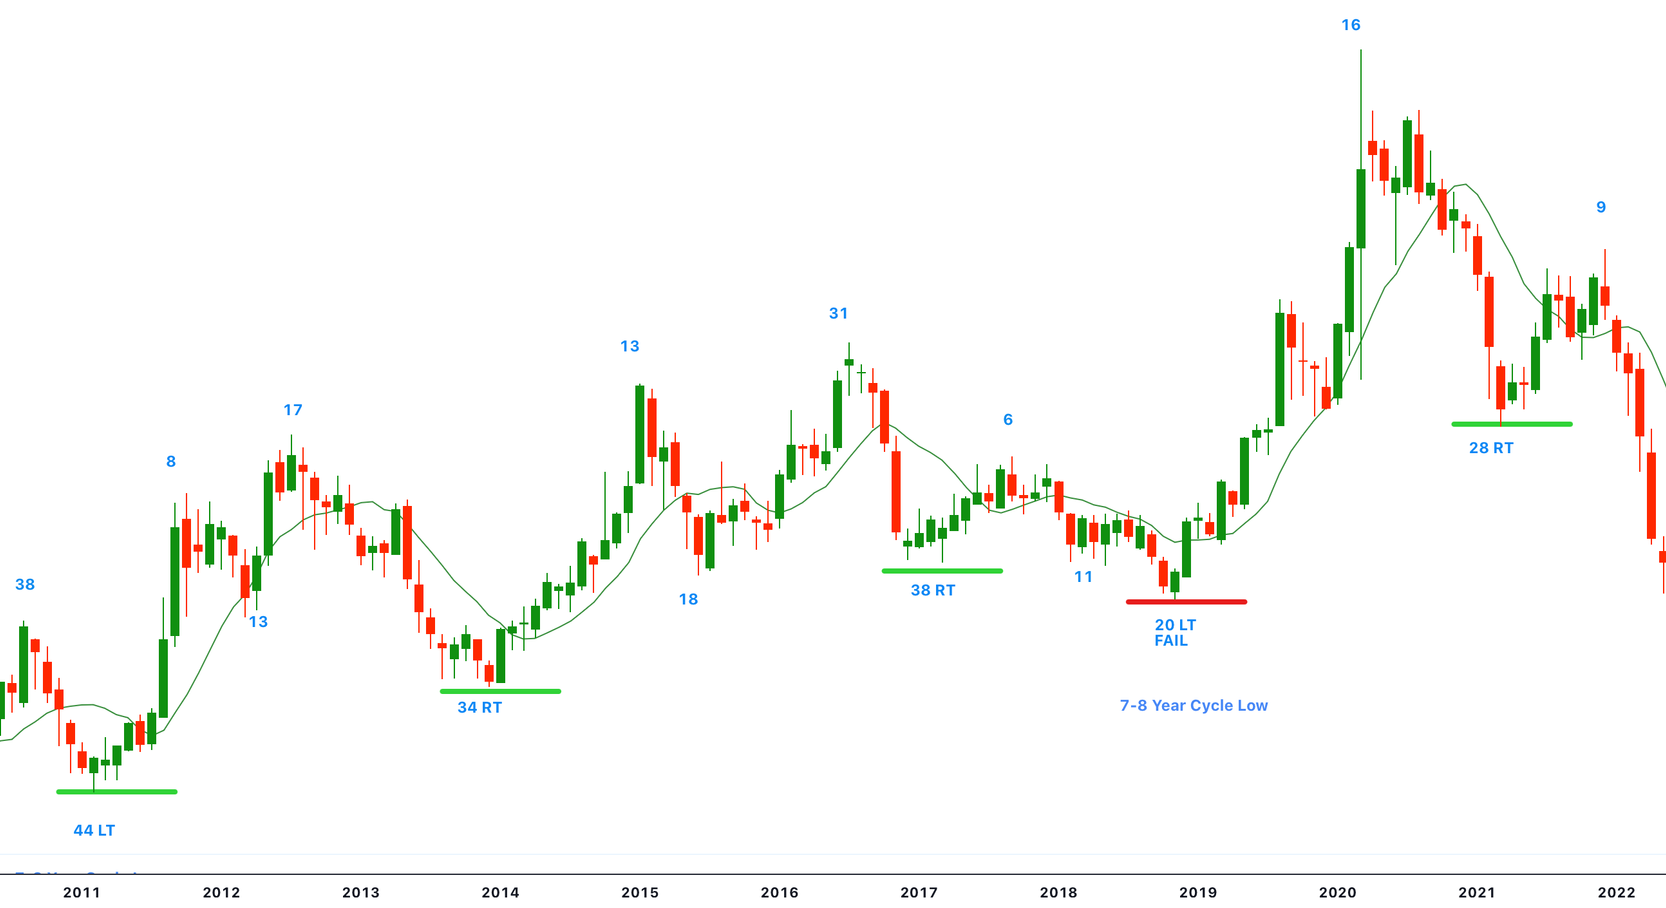
1st Yearly Cycle
- Starting Point: Yearly Cycle Low (YCL) and 7-8 YCL marked as 44LT FAILED cycle.
- HCH: HCH achieved on month 8
- HCL: HCL reached by month 13 showing support around 10 MA
- YCH: Peaks at month 17 making it RT Yearly Cycle
- YCL: Concludes with cycle low on month 34 RT cycle
2nd Yearly Cycle
- HCH: HCH achieved on month 13 - more bullish then prior cycle
- HCL: HCL reached by month 18 also later in the cycle
- YCH: Peaks at month 31 making it RT Yearly Cycle
- YCL: Concludes with cycle low on month 38 RT cycle, a long cycle
3rd Yearly Cycle
- HCH: Early HCH on month 6
- HCL: Failed yearly cycle on month 11
- YCL: Failed yearly cycle and expected 7-8 YCL on month 20 LT
Conclusion
By analyzing and understanding these cycles—Daily, Intermediate, and Yearly—investors and analysts can better predict market dynamics and make more informed decisions. Each cycle plays a crucial role in shaping the overall market environment, and their interactions offer valuable clues on future market behavior.

