Cycle Inversions
Collaboration with @GoldnGuitars at 𝕏

Cycle Inversions
As cycle analysts, we want the best entry points to capture a trending move on any given time frame (TF). We meticulously track the daily cycles as we patiently wait for the timing band of an ICL or YCL to come into view. When suddenly, unexpectedly, price reverses, catching us off guard. An expected 37-45 day cycle turns suddenly into 19 or 23. What happened? Cycle inversion.
In short, cycle inversion is when a main low on a given TF, comes in the expected timing band of the half-cycle low. This occurs as the result of the larger TF trend taking back control from the shorter term trend. Which is why it’s vital to know your multiple time frame analysis (MTFA).
Cycle inversion most frequently happens at specific points; the half-cycle low (of the daily, intermediate or monthly cycle) at the main cycle low of the daily, intermediate or monthly cycle.
Let’s take a look at a few examples:
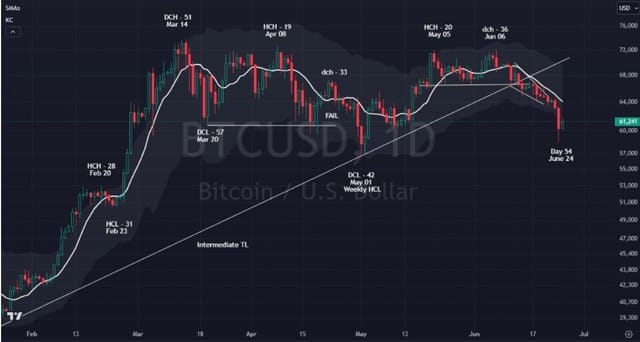
Inversion at the weekly HCL - Bitcoin printed a very RT DC1 out of a late January 2024 ICL but printed a LT top in DC2. It rolled over and printed an early DCL (inversion) on day 42.
Price had declined substantially - reaching the lower KC and the strong reversal candle combination was proof of the increased likelihood of inversion. Yet the most important factor in pinpointing the potential for inversion was using MTFA.
On the weekly chart it’s clear that bitcoin likes to get a bump at around weeks 13-15. The steep decline and then bounce from week 14 was a high probability move that can be prepared for and traded with good risk management.
Inversion at the ICL
After printing an ICH on day 28 of the third daily cycle, $MARA began it’s quest to find the next ICL. You can see from the cycle lengths given there is a fairly large TF for a DCL print, ranging from 38-48 days. After a left-translated top on day 7 of DC4, price declines quickly into a day 20 DCL/ICL.
How can you identify inversion or the potential for inversion? Remember that an intermediate cycle low will often have a significant decline lasting 5-7 days that makes all bulls give up and sucks in all the late shorts in the same way an ICH sucks in all the late bulls. If you’re noticing capitulation-esque price action, check your MTFA for corroboration. You can use your indicators as well. Candles printing into the lower KC / BB are a potential sign as are heavily oversold conditions / divergences on TSI / RSI.
Of these, the most important factor is knowing your MTFA. Cycle length variation on the weekly chart can make it tricky, but in our example, $MARA had printed a short 17 week cycle in the fall of 2023 (likely an inverted YCL!), so finding one in the more ‘typical’ range of 23-28 weeks should be expected. Once the candle on week 28 closed with a hammer on support, we knew that an ICL had likely come on an inverted daily cycle low.
Understanding what cycle inversion is and how to spot it is one of the key factors in getting high-quality entries in the stocks we want to buy.
Key points:
- Be on top of your multiple time frame analysis; whatever you’re trading, what the next larger TF.
- Keep in mind the likely areas where inversions occur (into half and regular cycle lows)
- Using price action (heavy decline into an ICL) as well as indicators (divergences, KC bands) can help, too.
Follow @GoldnGuitars on 𝕏 for more cycle insight

