Cycle Shapes & Trendlines
Introduction to Cycle Shapes in Market Trends
Market cycles are fundamental to understanding and predicting the movements within financial markets. These cycles, though consistent in their structure, can manifest inversely in bullish versus bearish conditions. By dissecting the individual steps of each cycle shape and understanding how they aggregate into higher time frame cycles, investors can gain a nuanced perspective on market dynamics and enhance their strategic decision-making.
Consistent Patterns
Each cycle, whether in a bullish or bearish market, follows a recognizable pattern. However, the manifestation of these patterns is often inverse depending on the overall market sentiment. In bullish markets, cycles typically show prolonged growth phases and shorter declines, while in bearish markets, rapid declines and brief recoveries are more common.
Cycle Shapes: Key Components and Their Interactions
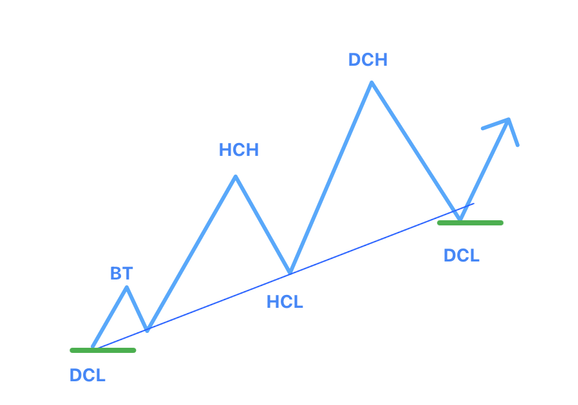
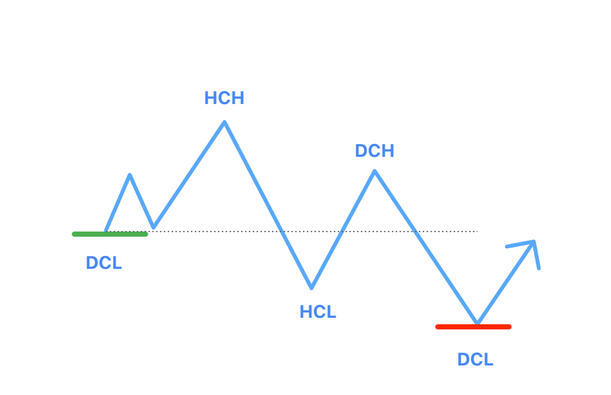
To effectively navigate and interpret market trends, understanding the fundamental structure of cycle shapes is crucial. All cycle shapes, regardless of market sentiment, consist of five distinct components. These components act as critical milestones in the progression of a cycle and help in determining the current and future market dynamics. Here's a brief overview of each component; for a detailed description, see the Introduction to Cycles.
- Opening Cycle Low (DCL/ICL/YCL): The initial low point that sets the stage for the cycle’s development.
- Half Cycle High (HCH): The first major peak after the Opening Cycle Low, providing early insights into the cycle's strength.
- Half Cycle Low (HCL): A crucial low following the Half Cycle High, offering a pivot point for future cycle trends.
- Cycle High (DCH/ICH/YCL): The peak of the cycle, which could be the highest or lowest point, depending on the cycle's strength and duration.
- Closing Cycle Low (DCL/ICL/YCL): The final low that concludes the cycle, setting the groundwork for the next cycle's beginning.
Assessing Bullish vs. Bearish Cycles
Determining whether a cycle is bullish or bearish is essential for strategic market positioning. This assessment is based on the interactions among the cycle components:
- Bullish Cycles: Characterized by consistently higher highs and higher lows, indicating a robust upward trend. These cycles suggest a strong market with potential for continued growth.

- Bearish Cycles: Marked by lower highs and lower lows, signaling a weakening trend and potential downturns.

Cycle Failure
In a bearish cycle, where lower highs and lower lows are printed, cycle failure refers to an instance where the price drops below the opening cycle low. Cycle failure gives us confirmation over a bearish cycle indicating price will further decline to the next cycle low.
Connecting Cycles Together
Now that we've looked at cycle shapes, let's connect them all together and look at overall cycle shapes with a bullish cycle

In a typical bullish cycle we see 4-5 cycles. The last cycle typically fails as it prints cycle low on the higher time frames. As cycle progresses, each DCL is printed with higher lows which DCH prints higher highs.

In a bearish market we typically see left translated cycles which continue to fail as the price prints lower lows and lower highs. The cycle peak in a bearish market peaks quite early which gives away cycle weakness as the price falls below the previous DCL.
Trendlines
Trendlines are a fundamental tool in cycle analysis used to identify and confirm the prevailing market direction and to signal potential reversals or breakouts. They are drawn on charts by connecting a series of prices points, typically using either the highs (for a downtrend) or the lows (for an uptrend) over a specified period
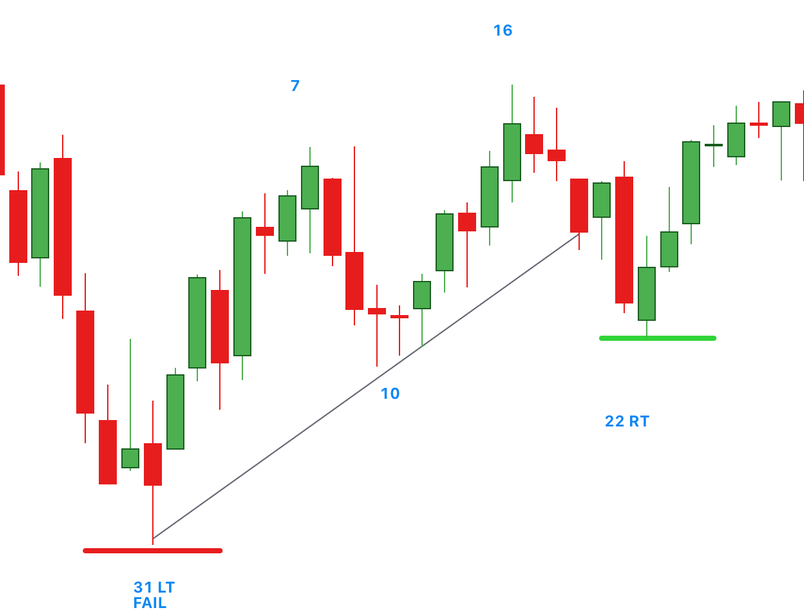
Within a bullish cycle, trendline is drawn connecting cycle bottom (DCL/ICL) to half cycle bottom (HCL). As the price declines to DCL, we expect the trendline to be broken. This pattern continues to repeat and assist cycle analysis to identify areas of interest for the cycle bottom.

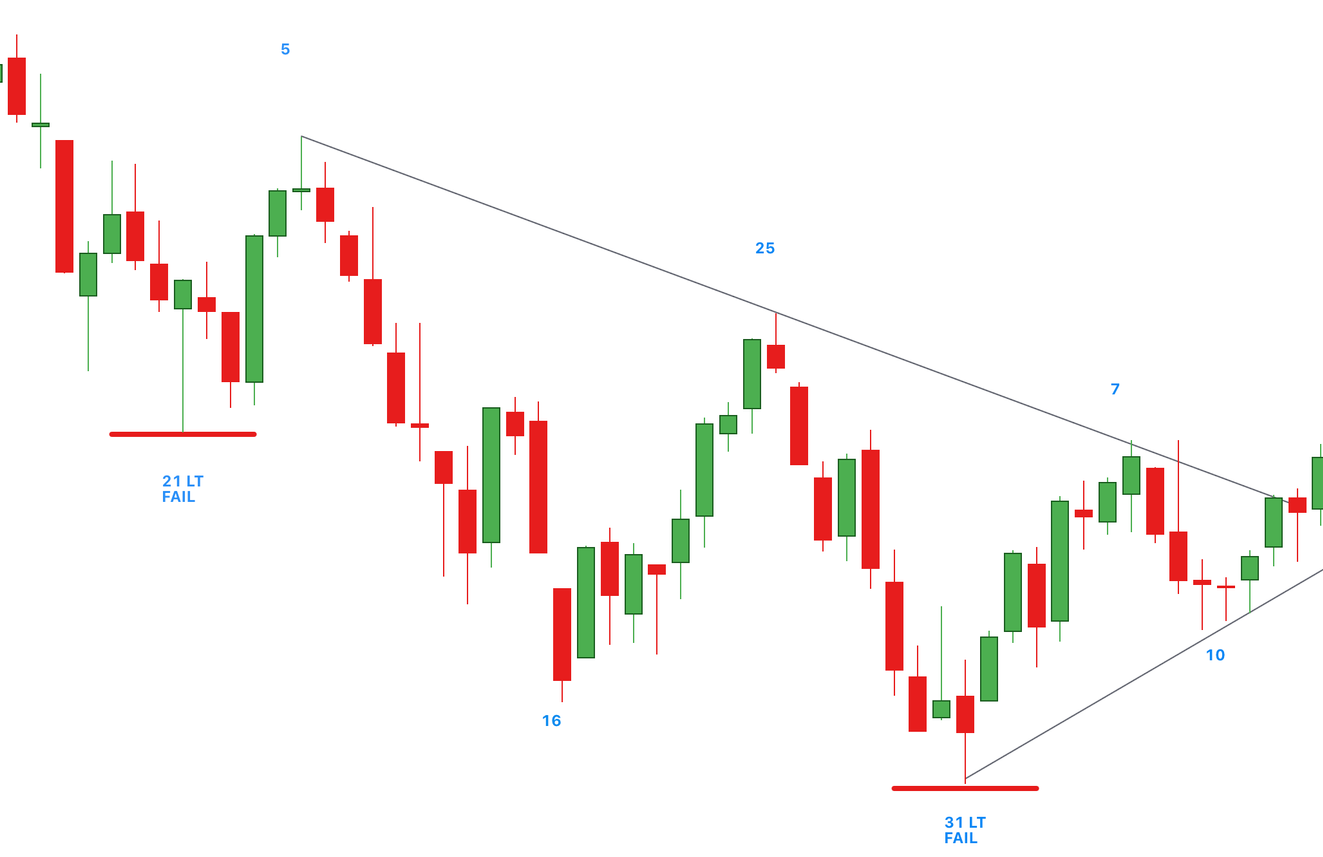
For the bearish cycle, the trendline is drawn between HCH and cycle high (DCH/ICH). Cycle low will be confirmed when the price closes above the declining trendline indicating change in trend.


