Divergences

Introduction
Divergences are pivotal in spotting potential reversals at cycle bottoms and tops. By comparing price action with indicators, investors gain crucial insights and early signals for shifts in cycle structure. Commonly, we work True Strength Index (TSI) with settings at 7, 4, 7, although similar results can be achieved with Relative Strength Index (RSI) or Stochastic Oscillator. In this post, we'll explore the types of divergences, how to identify them, and how they can be applied to different timeframes.
Types of Divergences
Regular Divergences:
Positive Divergences:
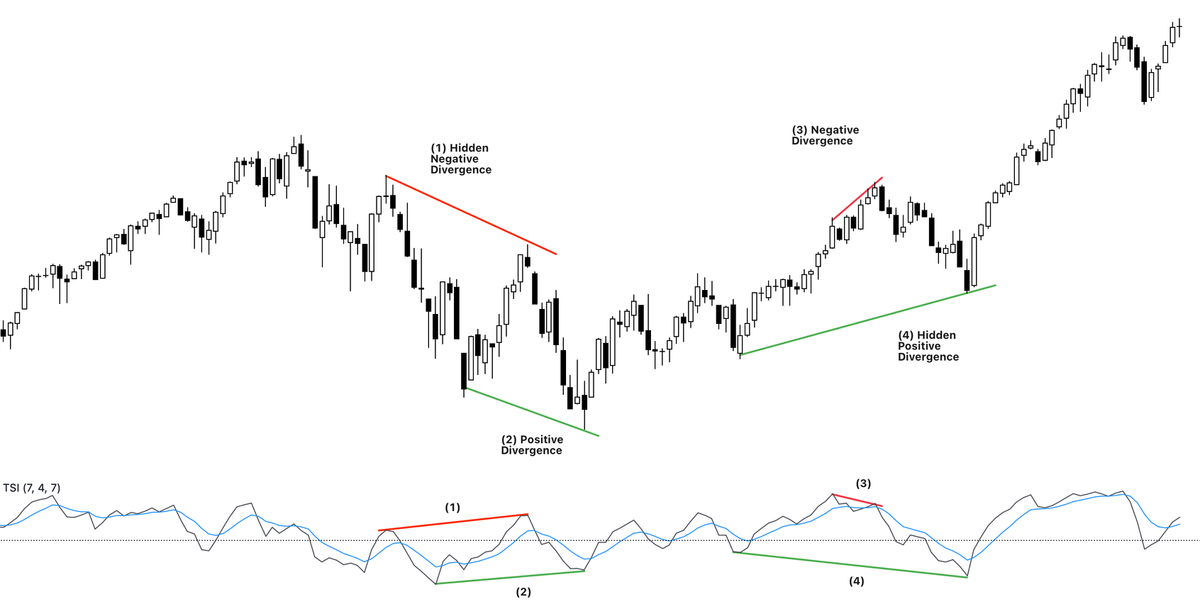
- Price makes a lower low, but the indicator forms a higher low, suggesting a potential bullish reversal.

Example: $ORCL, the price printed a lower low between June-Sep 2022 (green line) while TSI indicator showed divergence with higher lows for the same period. Indicating accumulation and an ending to the bearish cycle.
Negative Divergences:
- Price reaches a higher high, while the indicator creates a lower high, indicating a possible bearish reversal.

Example: $XLF price was printing higher highs in 2021 (red line) while TSI indicator was showing lower highs. This shows distribution and early sign for cycle top before a decline to a scheduled cycle bottom.
Hidden Divergences:
Hidden Positive Divergences:
- Price forms a higher low, but the indicator creates a lower low, implying strengthening bullish momentum.

Example: $MMM price was showing higher lows while TSI indicator was showing lower lows indicating continuation of cyclical push and a start of another weekly cycle higher.
Hidden Negative Divergences:
- Price makes a lower high, while the indicator forms a higher high, signifying increasing bearish momentum.

Example: $ADM was printing lower highs from late 2022 to mid 2023 while TSI indicator was showing higher highs. Hidden negative divergence indicating futher selling and bearish continuation.
Timeframes and Divergences
Divergences are observable across all timeframes; however, their implications take longer to materialize on monthly charts. From our experience, daily and weekly cycle charts offer the most effective and actionable signals.
Conclusion
Divergences provide a simple, yet effective framework for analyzing market trends and pinpointing potential cyclical turning points. By comparing indicator readings with price action, cycle analysts can uncover regular and hidden divergences, giving an early indicator of trend reversal. Integrating divergences with cycle analysis will enhance the understanding and allow to confirm overall view of the market. +1 in for your cycle toolbox. 😊
I've created a quick reference guide for all divergences below - $SPX.


