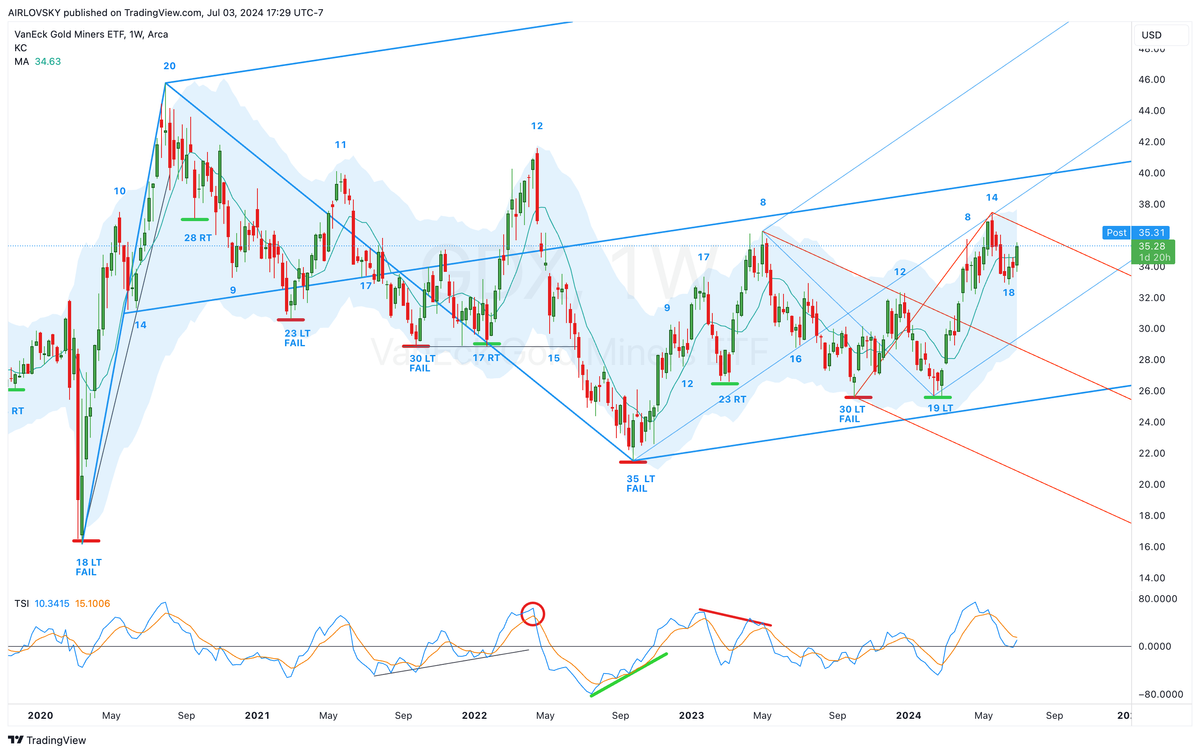
$GDX Weekly Cycle Update - Is a Swing Low in Sight?

Hello everyone,
As we step into July, it's a critical time to examine the weekly cycle structure of $GDX. With the low candle printed on week 18, historical patterns suggest that this timing aligns well with previous cycles, such as the week 17 low in January 2022 and the week 19 low in February 2024.
Key Observation:
A particularly interesting development is the potential bullish crossover on the True Strength Index (TSI) above the zero line. Remember, the TSI setting is at 7,4,7, which is typical for cycle analysis.

Monthly Cycle Overview for July
The monthly indicators are showing bullish signals, especially with the price remaining above the 10-month moving average (10MA). While we're still contending with a bearish modified fork, the formation of a higher high relative to 2023 is a positive sign.
Let’s keep a close eye on how this week concludes. The possibility of a week 18 ICL certainly remains on the table.

This has implications on $Gold cycle as well, which we will cover on the Weekly Cycles Newsletter.
BONUS CHART: $GDXJ
For $GDXJ, things are looking up as well. It’s a bit early for an ICL, but the daily cycle has held strong. A weekly close above the median line might indicate that we’ve managed to secure an early ICL without a daily cycle failure.

Stay Ahead of the Curve with Exclusive Insights
If you find these analyses useful and wish to delve deeper into cycle analysis, I invite you to sign up for the Airlovsky Weekly Cycles Newsletter.

